There are various ways , in which you can profile your WCF Service application. Traditionally you might use a web application which will invoke the WCF API's to profile it. Today , we can learn to use WCFTestClient.exe, through which we can invoke WCF Service and profile it.
WCFTestClient is a nice tool using which you can invoke , your WCF service with out developing a client application to test it.
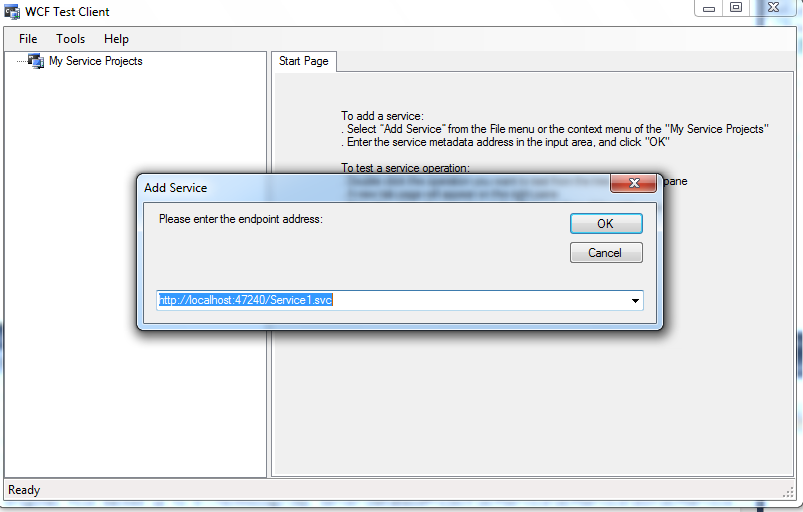
WCFTestClient can be found under \Program Files\Microsoft Visual Studio 10.0\Common7\IDE (if you are using VS2010 ultimate/premium) and for VS2008 it can be found under \Program Files\Microsoft Visual Studio 9.0\Common7\IDE. You can also open up WCFTestClient by using VisualStudio Command Prompt. Here is a snapshot of WCFTestClient.
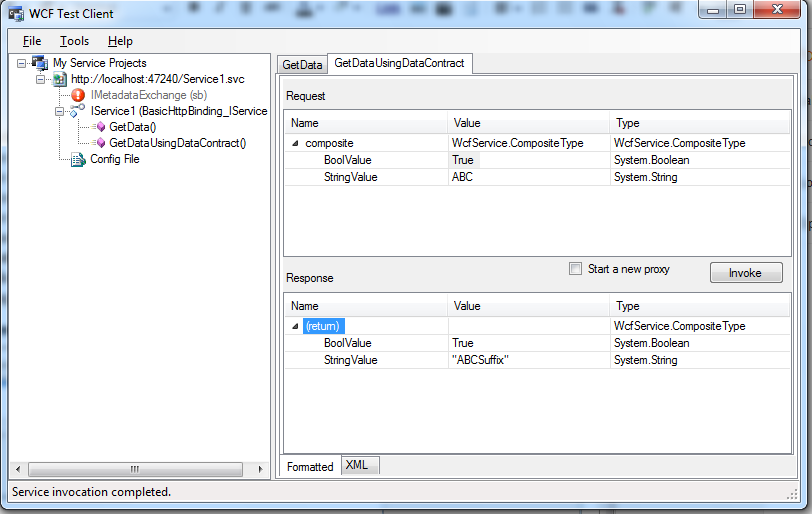
For this blog, I have used the sample API's that comes along with a new WCF Service Application project template.
 |
| Page1 |
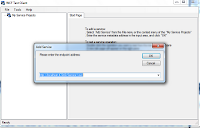
In Visual Stdio 2010 (premium/ultimate edition), start a new performance session , by clicking analyze-> launch performance wizard. For this blog I have chosen to profile under instrumentation method. Click next and choose the WCF service which you want to profile and click next. In page 3 of performance wizard , it will ask you to choose which client you want the profiler to use to execute your service. Choose external program and select the path where WCFTestclient.exe is ( \Program Files\Microsoft Visual Studio 10.0\Common7\IDE) and click next and click finish to start profiling.
 |
| Page2 |
 |
| Page3 |
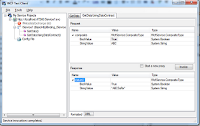
The performance session will bring up the WCFTestClient. Right click on My Service Projects and add the endpoint address of your WCFService. The service will be added , invoke the API's. The profiler will be collecting the data, upon invoking the
API's . Once you are done stop the WCFTestClient and a profiler report (*.vsp file) will be added into the performance explorer. Analyse the profiler report to optimize your WCF Service.

Happy Coding!


Good post. Any idea how to do it in VS2015?
ReplyDelete