There are various ways , in which you can profile your WCF Service application. Traditionally you might use a web application which will invoke the WCF API's to profile it. Today , we can learn to use WCFTestClient.exe, through which we can invoke WCF Service and profile it.
WCFTestClient is a nice tool using which you can invoke , your WCF service with out developing a client application to test it.
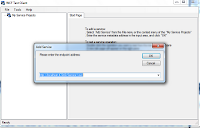
WCFTestClient can be found under \Program Files\Microsoft Visual Studio 10.0\Common7\IDE (if you are using VS2010 ultimate/premium) and for VS2008 it can be found under \Program Files\Microsoft Visual Studio 9.0\Common7\IDE. You can also open up WCFTestClient by using VisualStudio Command Prompt. Here is a snapshot of WCFTestClient.
For this blog, I have used the sample API's that comes along with a new WCF Service Application project template.
 |
| Page1 |
In Visual Stdio 2010 (premium/ultimate edition), start a new performance session , by clicking analyze-> launch performance wizard. For this blog I have chosen to profile under instrumentation method. Click next and choose the WCF service which you want to profile and click next. In page 3 of performance wizard , it will ask you to choose which client you want the profiler to use to execute your service. Choose external program and select the path where WCFTestclient.exe is ( \Program Files\Microsoft Visual Studio 10.0\Common7\IDE) and click next and click finish to start profiling.
 |
| Page2 |
 |
| Page3 |

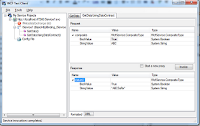
The performance session will bring up the WCFTestClient. Right click on My Service Projects and add the endpoint address of your WCFService. The service will be added , invoke the API's. The profiler will be collecting the data, upon invoking the
API's . Once you are done stop the WCFTestClient and a profiler report (*.vsp file) will be added into the performance explorer. Analyse the profiler report to optimize your WCF Service.


Happy Coding!
